On a rainy week in May, students from the Zhiibaahaasing and Sheshegwaning First Nations saw their water in a new light.
We delivered our hands-on What’s in Your Water program to the students of St. Joseph’s Anishinabek School on Manitoulin Island. Over four days, students of all ages took part in STEM-based water science workshops designed to familiarize them with hydrology and watershed ecology, while further developing their relationship with water and their land.
“We did eight workshops, including an introduction to water filtration processes and a water treatment plant tour for the Grades 6-8 students,” said Adrianna Bilinski, Water First Indigenous School Engagement Coordinator.
These snapshots tell the story of the hands-on learning the students enjoyed and how they came to be informed and inspired advocates for their community’s watershed.
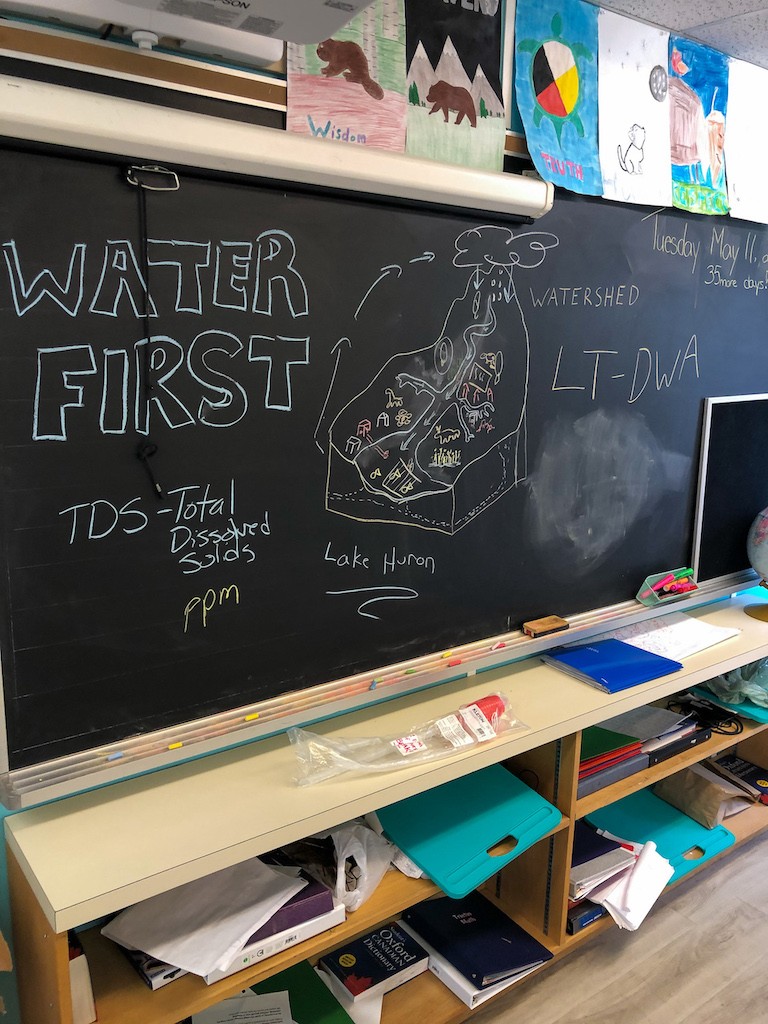
Setting the stage for learning about watersheds
“Typically, we have a PowerPoint presentation to accompany the in-class lesson, but there was no projector in the school,” said Adrianna.
“In some ways, the lesson turned out better with the chalkboard. We drew an outline of a watershed and students came up and filled in the elements. It was interactive and fun.”
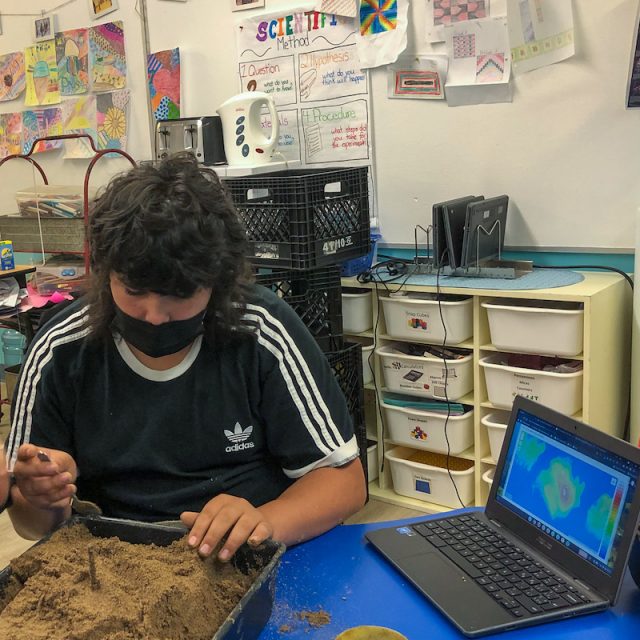
Building a topographic model
Now that students had been introduced to what a watershed consists of, they built their own model. Consulting a topographic map on a computer, they used sand, twigs and moss to represent various elements of the watershed, including houses, roads and farms. They also added components that are sources of pollutants, such as the garbage dump, cars, a gas station and campsites.
When their topographic model was complete, a sheet of saran wrap and a thin layer of sand were placed on top. When water was gently poured over it, students could see how the water flows across the land—and where pollutants enter the water system.
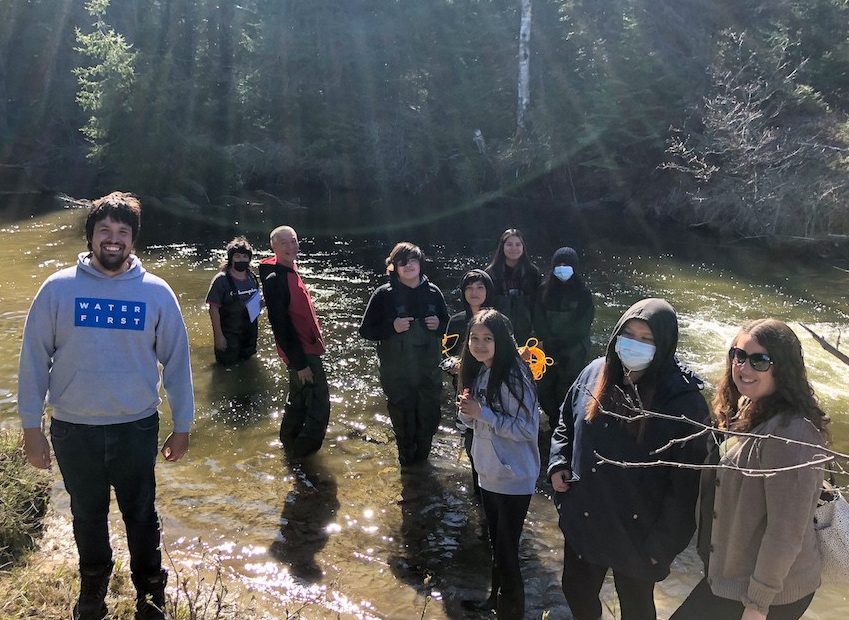
Field trip day to Silver Creek
Education Manager Dillon Koopmans escorted students to Silver Creek, where they met Joe Shinos, one of the community speakers. He and his team were cleaning this stream of trash and natural debris to allow for a steadier flow of water. Students put on waders and helped out.
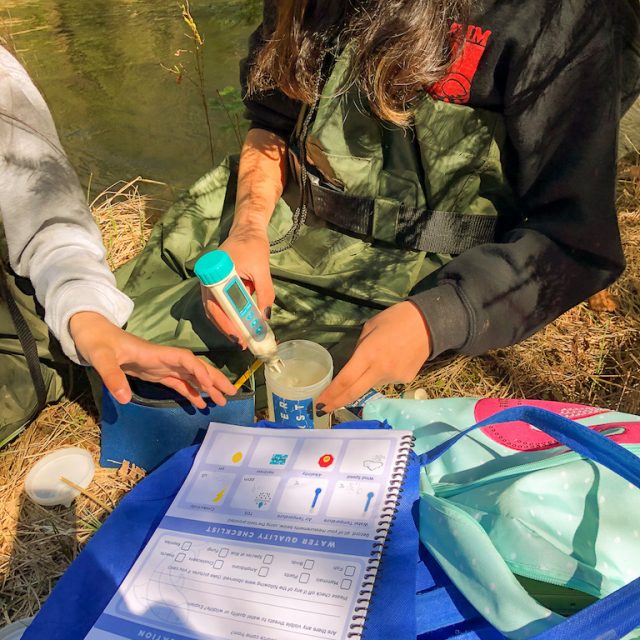
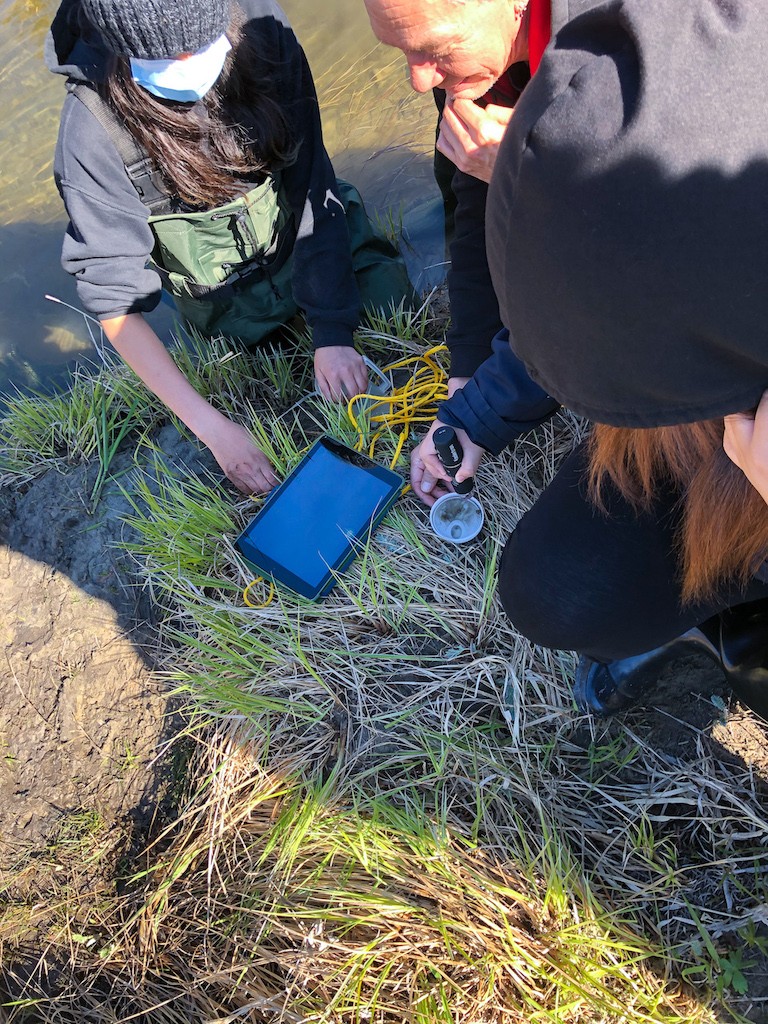
Testing raw water at Silver Creek
Students used a multiparameter reader to measure the conductivity and temperature of the water, as well as the total dissolved solids (TDS) in it.
Measurements like these reveal the general health of the water. Students learned why higher temperature, conductivity and TDS might mean there are too many metals, mercury, salt or foreign objects for a healthy watershed.
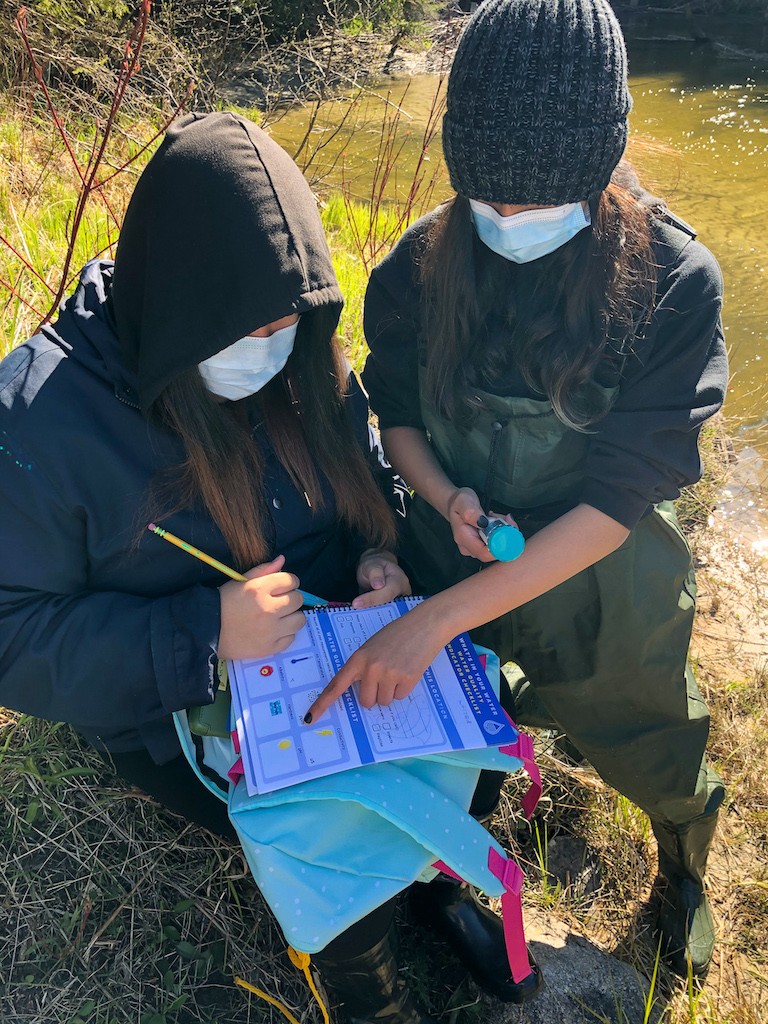
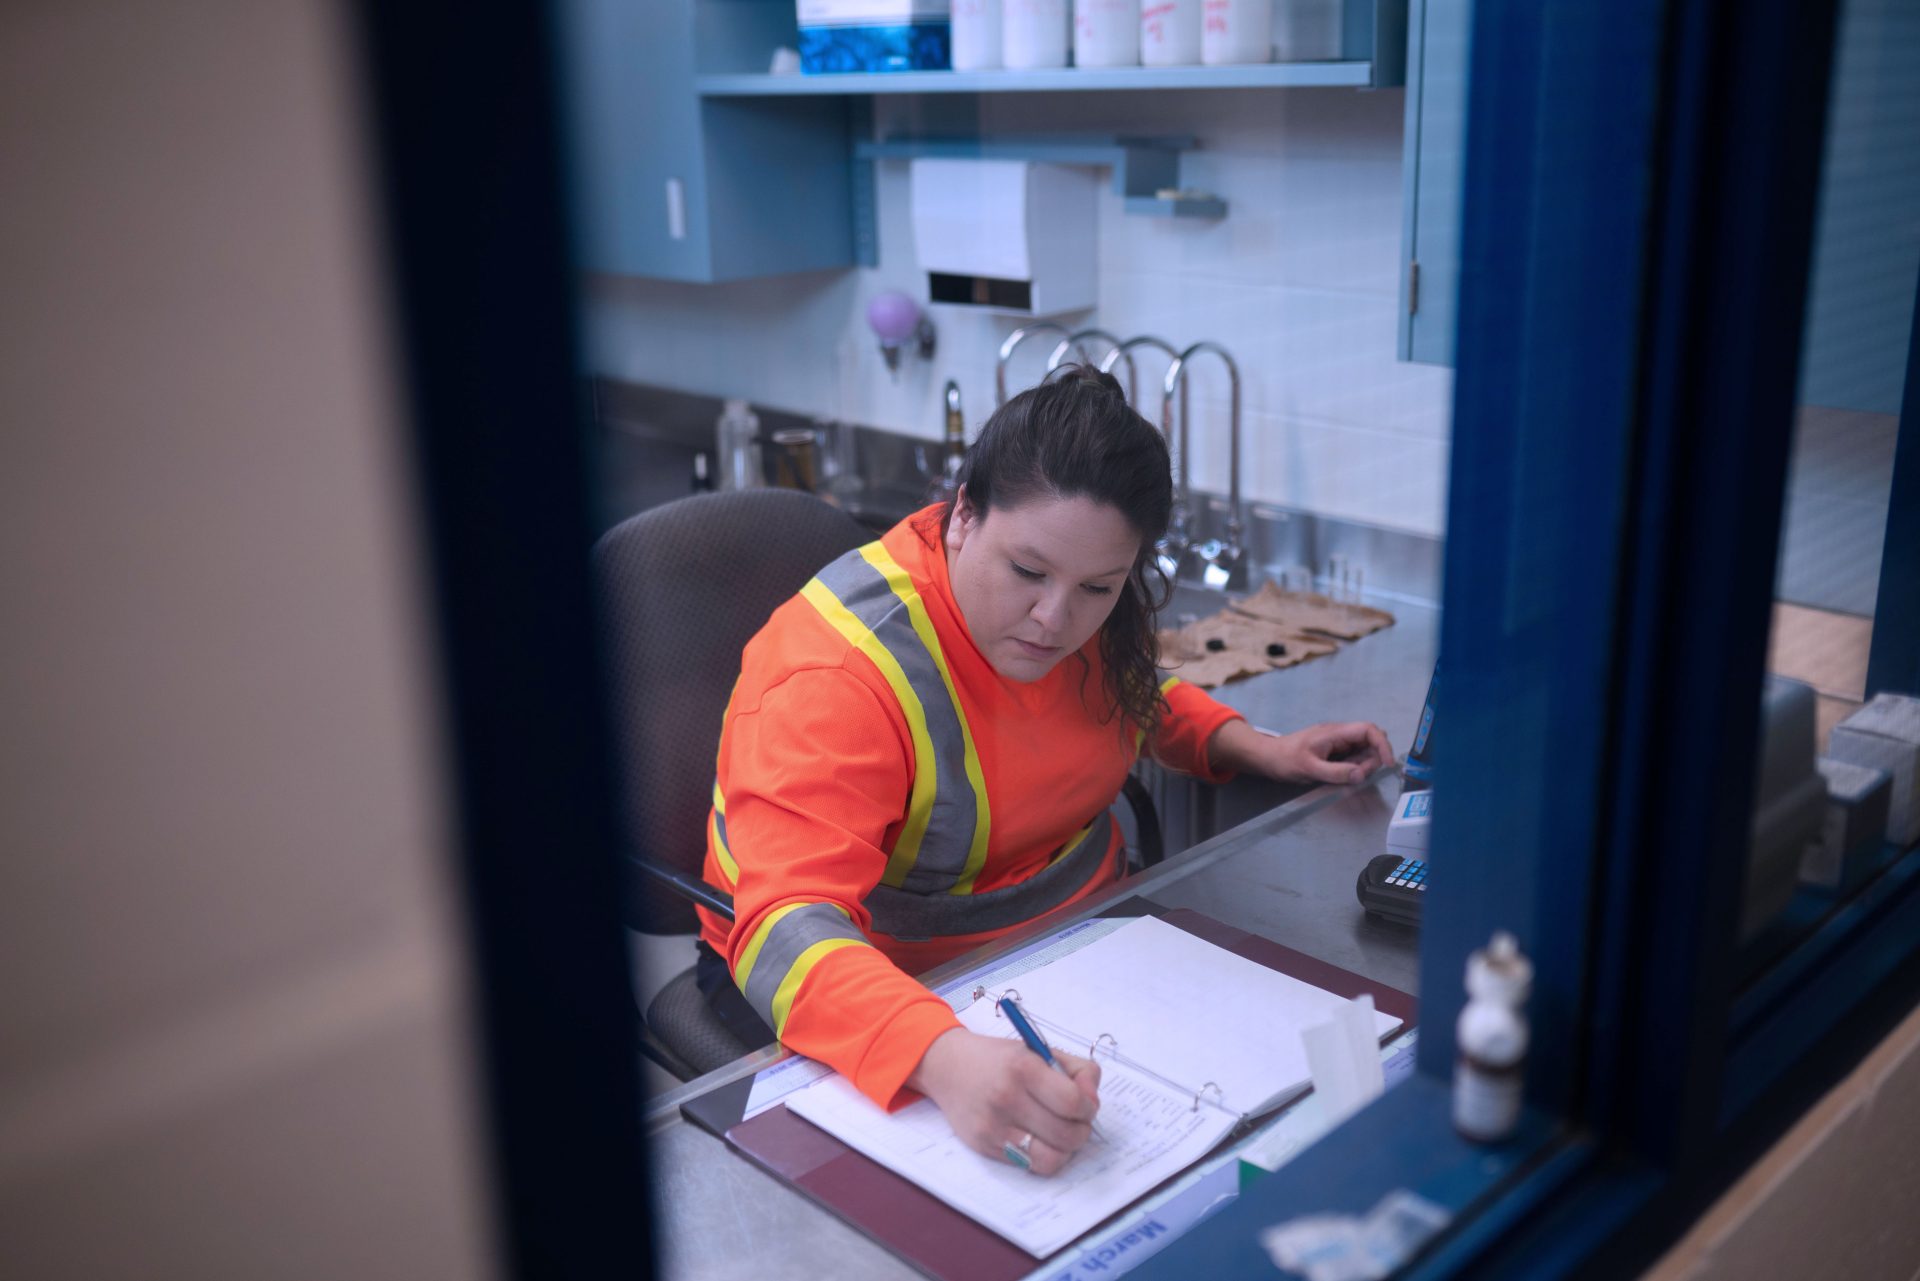
Logging data for future analysis
Recording results is an important part of data collection. Students received field workbooks to record their water quality results to bring back to class for analysis.
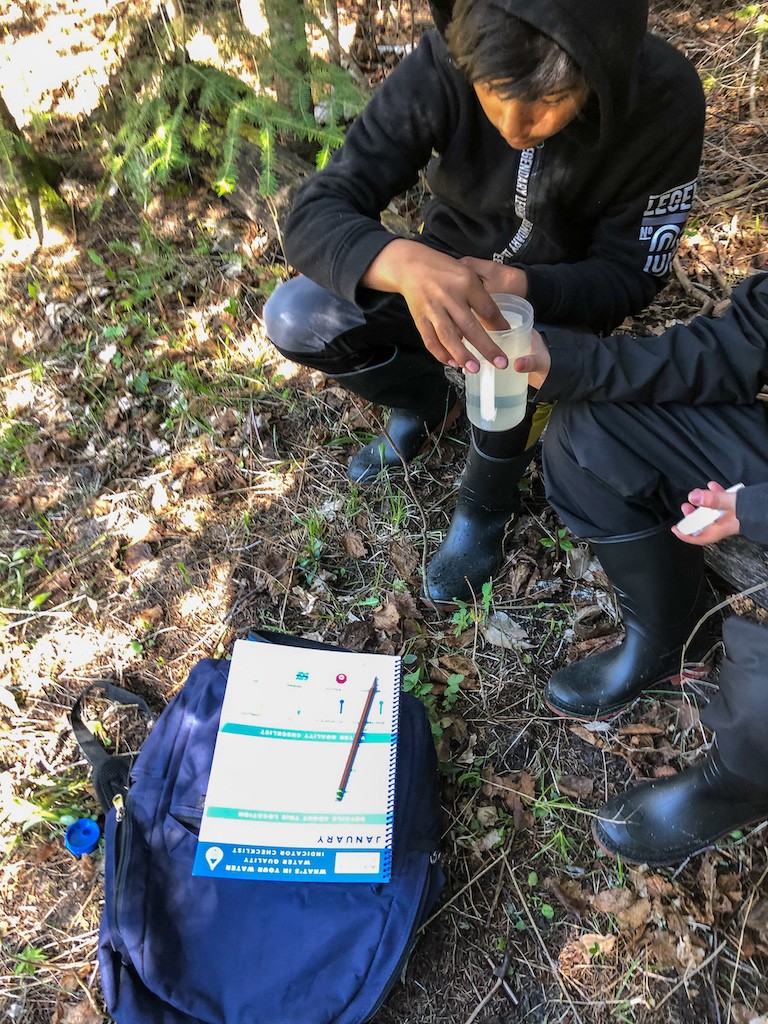
Testing for pH
A healthy stream has a pH between 6.5 and 8.5. Alkalinity is the ability of the stream to resist changes in pH. Using pH strips, students tested the water to measure the pH and alkalinity to see if it’s safe for fish.
“The analogy we use with kids is that alkalinity acts as a shield for the water. If it’s low, the water is at risk of a drastic pH change, which could cause fish populations to decrease. It’s an important thing to know about our water,” said Adrianna.
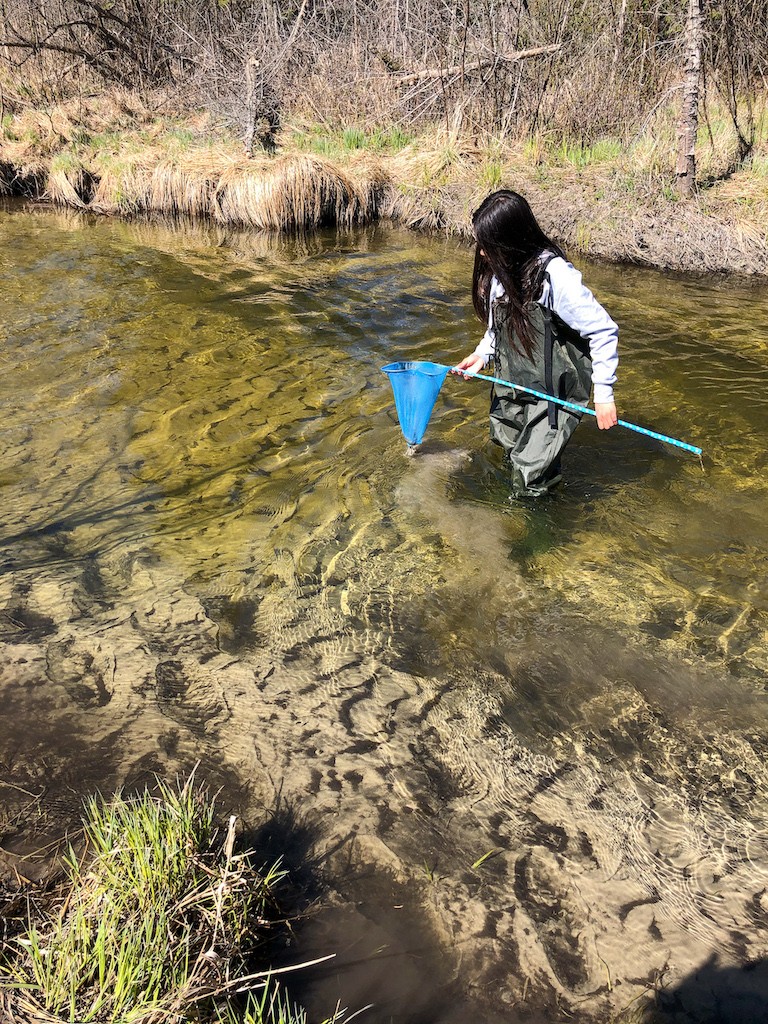
Catching microscopic critters
Another indicator of the health of a stream is the number and type of live microscopic creatures, called protozoa, that live in the water. Using a net, students brought in a number of living organisms to examine under a microscope on the shoreline.
Peering at larva under a microscope
A microscope was connected by Wifi to an iPad, so the students were able to get a close look at the critters they brought in. This group brought in mayfly larva, while another examined mosquito larva wiggling around a petri dish. Back in the classroom, younger grades examined an earthworm, ant, spider and beetle under their microscopes.
This is a lesson about bioindicators. For example, a dragonfly will only live in a clean water body area. So, if they are flitting around a stream, you know it’s clean. In comparison, a water beetle isn’t so picky. They can be found in very polluted water and survive.
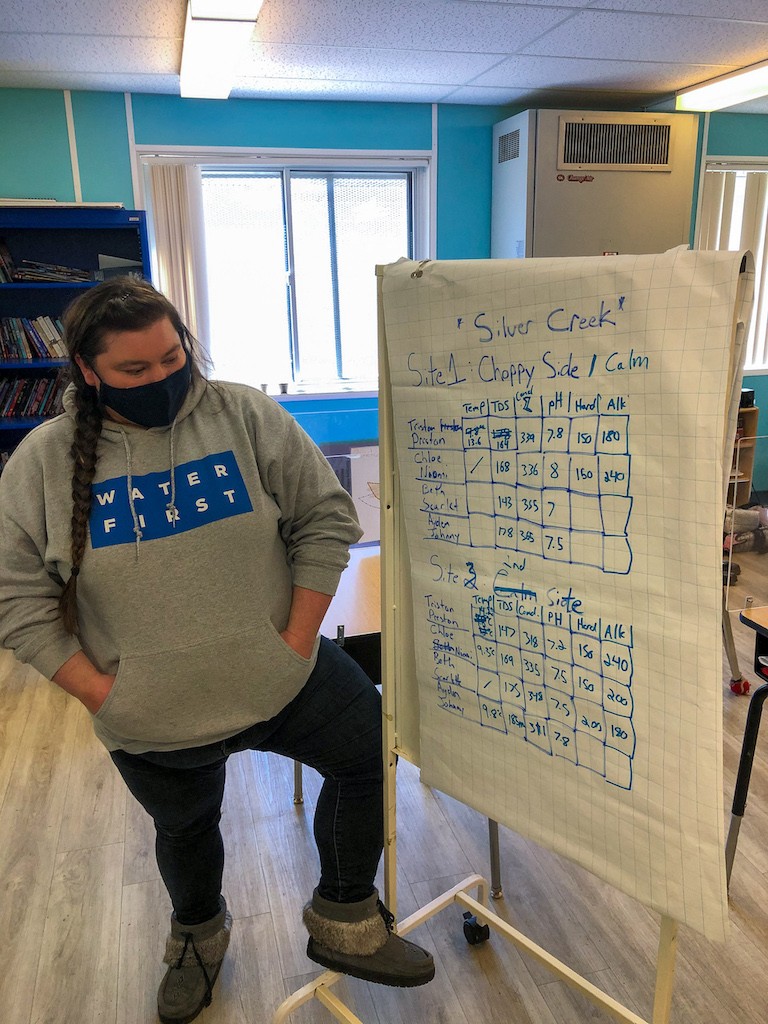
Analyzing data back in the classroom
Using the data students collected in the field, Adrianna created a table to help the students analyze their findings. “The students looked at all the group measurements for the water and found the average of all results. We talked about whether those numbers were good or bad,” she said.
“For the most part, the water bodies we studied are healthy. This was an ‘aha’ moment for them because in prior lessons we discussed the ideal range for a healthy water body. They were then able to make the connection between the ideal range and their water.”
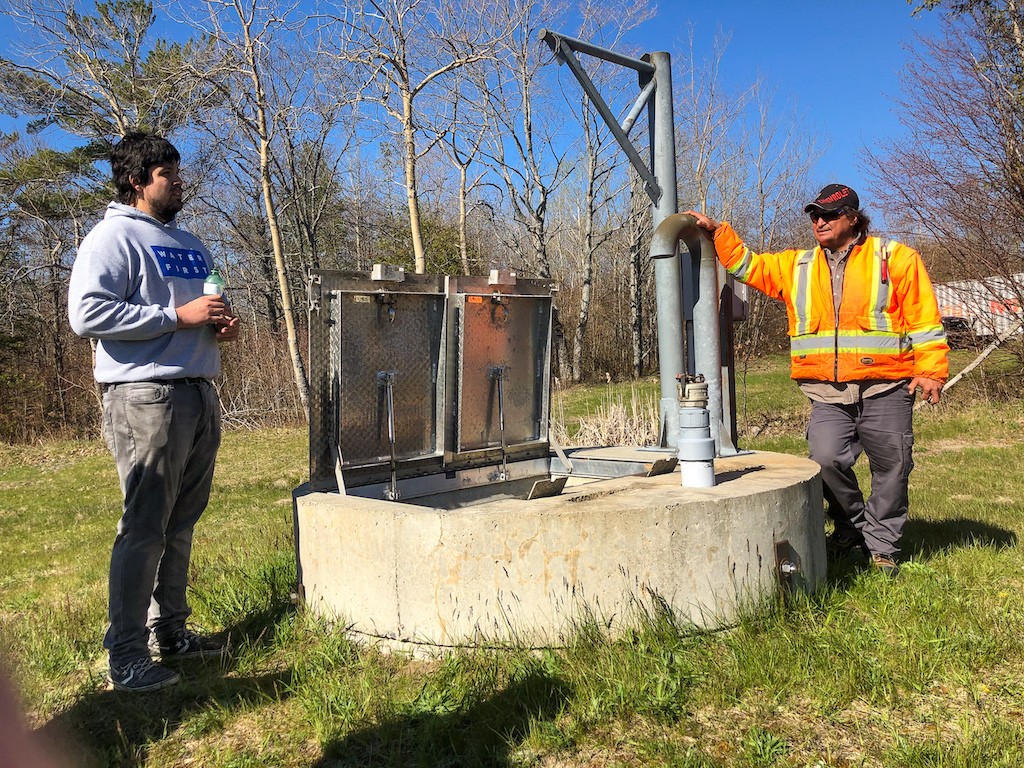
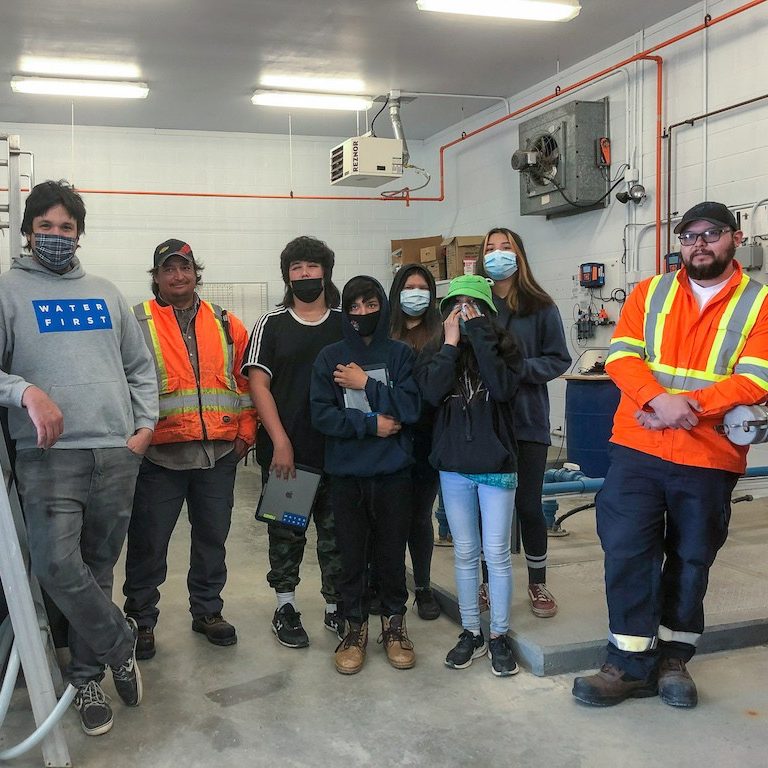
Water treatment tour
Dillon and Pat Cada, the Overall Water Treatment Operator at the local water treatment plant, showed the students the filter at the water treatment plant.
Inside the water treatment plant
Thanks to a connection with Water First intern alumni Alex Nahwegahbow, students were able to have a personalized tour of the water treatment plant. The students watched water go through the slow sand filter inside the plant. They also got to turn on the fire pump that sends water to fire hydrants – a cool experience for students to see the technical aspects of their daily life.
At the end of the week, students shared that the plant tour was their favourite part of the program. “Maybe it’s because they got to talk with the two community members who run the plant, see the different processes and where the water from their house comes from,” said Adrianna.